Julian Lee and Alaric Nightingale, Bloomberg News
LONDON
EnergiesNet.com 07 27 2022
Another week, another sign that Russia is struggling to get its oil to market.The nation’s shipments to buyers have declined for five consecutive weeks, taking them down by 480,000 barrels a day, or 13%, since mid-June. That’s based on a rolling four-week average that helps to provide a better picture of the trend than the observation of flows from one week to the next.Traders and investors are monitoring Russia’s crude flows closely, since what happens to them is central to the global oil market and how tight it gets. The shipments also go a long way to determining how much money flows into the Kremlin’s coffers to fund the war in Ukraine.
In the aftermath of the invasion, large numbers of European companies stepped back from dealing with Russia, with Asia — specifically China and India — filling the void that was created. But there are tentative signs the two nations’ appetite is decreasing.Shipments to China and India are down by somewhere between 15% and almost 40% from their post-invasion peak, according to the ship tracking data monitored by Bloomberg for this story. The final scale of the drop will depend on where almost 4 million barrels of crude on tankers that are yet to show final destinations is discharged. Much may eventually go to Asia.There’s still a long way to go before a drop in shipments hits the Kremlin’s war chest hard enough to give President Vladimir Putin second thoughts about his invasion of Ukraine. Rising crude prices have boosted Russia’s export duty rates this month, offsetting some of the reduction in flows. While shipments in the week to July 22 fell to their lowest since the week ending March 25, export revenues were the lowest in only four weeks.
Crude Flows by Destination:
- Asia
Asian countries, dominated by China and India, are still taking more than half of all the crude shipped from Russia, up from about one-third before the invasion. Flows to Asia have accounted for between 55% and 56% of Russia’s total seaborne exports since early June.Shipments to China averaged 810,000 barrels a day in the most recent four-week period, down from a revised 862,000 barrels a day in the four weeks ended July 15. Flows to India were 739,000 barrels a day, compared with a revised 757,000 barrels a day.Those figures may rise, once destinations become known for crude on tankers that are yet to signal final locations. Shipments to Asian countries other than China and India have all but dried up, with only rare cargoes heading to Japan and South Korea from Pacific terminals. A second tanker is signaling its destination as Colombo in Sri Lanka after the Nissos Delos discharged its cargo there in May. The aframax Zhen I is due to arrive on August 12.
Based on current destinations, the average flow of Russian crude to Asia in the four weeks to July 22 was the lowest in 16 weeks, at 1.75 million barrels a day. That will remains true even if all the crude on tankers yet to indicate whether they are heading start to signal Asian ports in the coming weeks.
- Europe
The volume shipped from Russia to northern Europe is continuing to creep back up. Most of that is going into storage tanks at Rotterdam in the Netherlands, with small volumes going to Poland and Finland. Flows in the four weeks to July 22 averaged 490,000 barrels a day, the highest in 12 weeks (see chart below)
Four-week average shipments of Russian crude to the Mediterranean, which soared after the invasion of Ukraine, have been falling since mid-June. In the period to July 22, they were the lowest in 14 weeks, driven by a drop in volumes heading to Turkish ports (see chart below).
Lukoil’s ISAB refinery on the Italian island of Sicily remains a key buyer of Russian crude
Combined shipments to Bulgaria and Romania have fallen by 45% since mid-June on a four-week rolling average basis, averaging 208,000 barrels a day in the four weeks to July 22 (see chart below). Deliveries to Bulgaria have fallen from their June highs, while shipments to Romania in the latest four-week period were less than half their recent peak.
Flows by Export Location
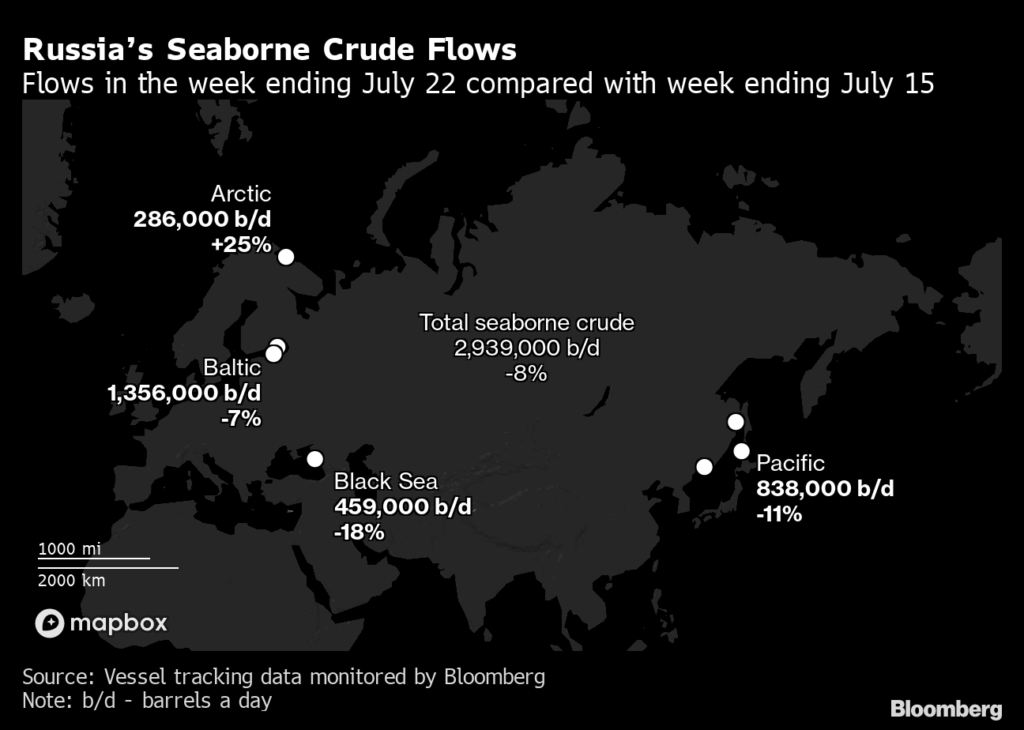
On a week-on-week basis, aggregate crude flows from Russian ports fell by 250,000 barrels a day, or 8%, to 3.19 million barrels a day in the seven days to July 22.
A gain in shipments from the Arctic was offset by falls from the other three exporting regions, to leave Russia’s seaborne shipments at their lowest since the week ending March 25 on an individual-week basis.
Export Revenue
Moscow’s revenue from export duty slipped in the week to July 22, down by $13 million, or 8%, to $155 million from $168 million in the week to July 15, according to calculations by Bloomberg.
The dip took weekly duty revenues to their lowest in four weeks.
Crude shipments in July earn the Kremlin $55.20 a ton (about $7.53 a barrel), up from $44.80 a ton ($6.11 a barrel) in June. That is the highest duty rate charged by the Russian government since April, reflecting an increase in Urals prices between mid-May and mid-June compared with the month earlier. But rates will ease slightly in August, dropping to $53 a ton (about $7.23 a barrel).
Origin-to-Location Flows

The following charts show the number of ships leaving each export terminal and the destinations of crude cargoes from each of the four export regions.

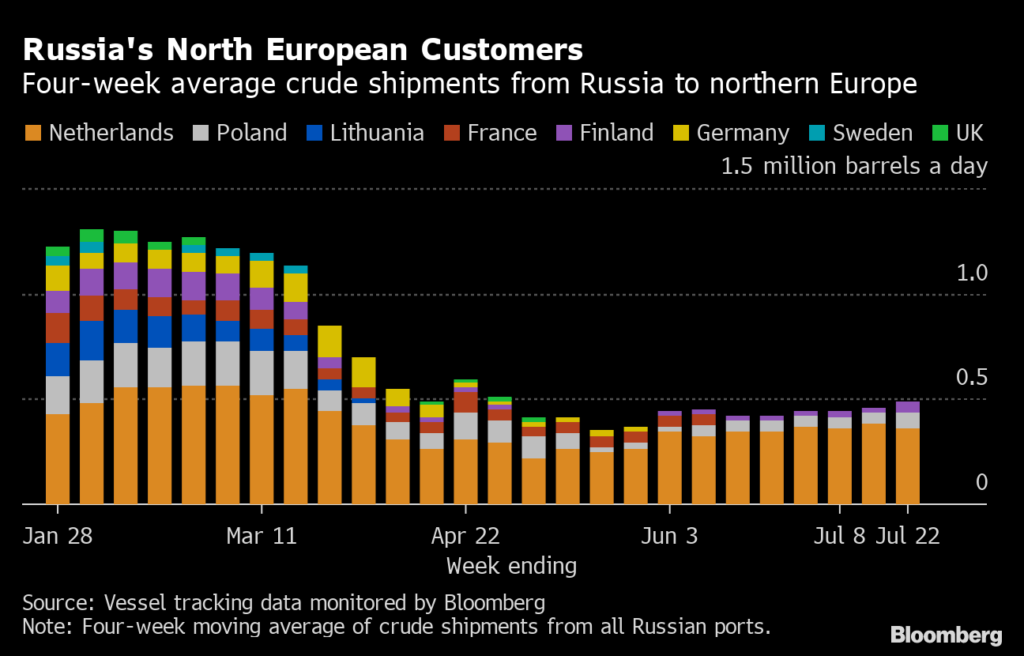
A total of 27 tankers loaded 20.6 million barrels from the country’s export terminals in the week to July 22, vessel-tracking data and port agent reports show. Destinations are based on where vessels signal they are heading at the time of writing, and some will almost certainly change as voyages progress.
The total volume of crude on ships loading from the Baltic terminals at Primorsk and Ust-Luga edged lower in the week to July 15, with three fewer tankers leaving Primorsk more than offsetting two more leaving Ust-Luga.
The volume on tankers loading at Baltic terminals and showing destinations in northern Europe rebounded to equal its highest since March, while the volume of crude heading to the Mediterranean slumped.
Flows from the Baltic to Asia fell to just 209,000 barrels a day, but with the equivalent of 417,000 barrels a day on ships yet to show a final destination, this figure will almost certainly rise.
Four tankers completed loading at Novorossiysk in the Black Sea in the week to July 22, down by two from the previous week and the smallest number in more than three months. One suezmax is yet to signal a credible destination, with its cargo likely to end up in Asia. Two aframaxes remained within the Black Sea.
Two suezmax tankers loaded from Gazprom Neft’s Umba floating storage unit at the Arctic port of Murmansk in the week to July 15. Both are headed to India.
Crude flows from Russia’s three eastern oil terminals — Kozmino, De Kastri and Prigorodnoye — slipped week-on-week to 838,000 barrels a day.
Eight tankers loaded ESPO crude at Kozmino, unchanged from the previous week. One cargo is heading for India, while China has taken the others.
There were no shipments of Sokol crude from De Kastri, nor of Sakhalin Blend from Prigorodnaya on Sakhalin Island.
Note: This story forms part of a regular weekly series tracking shipments of crude from Russian export terminals and the export duty revenues earned from them by the Russian government.
Note: Aggregate weekly seaborne flows from Russian ports in the Baltic, Black Sea, Arctic and Pacific can be found on the Bloomberg terminal by typing {ALLX CUR1 }
bloomberg.com 07 26 2022


