By The Learning Network, NYTimes
NEW YORK
EnergiesNet.com 12 02 2022
Many countries vowed to sever economic ties with Russia after it invaded Ukraine on Feb. 24, 2022. They implemented economic sanctions with the goal of imposing severe consequences on Russia for its actions and thwarting Russian abilities to continue the aggression. But as one of the world’s most important producers of oil, gas and raw materials, Russia has longstanding and lucrative trade partnerships which has made severing all ties difficult.
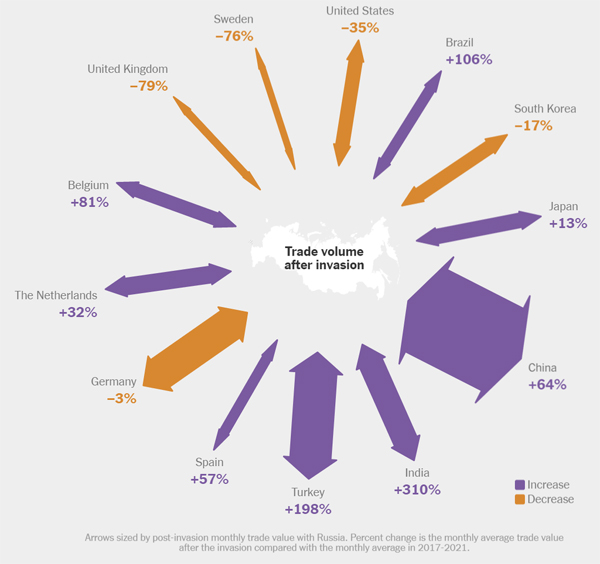
This graph, which was previously published in The New York Times, shows Russian trade value — exports plus imports, for countries for which sufficient data was available. Two variables related to average monthly trade value are: the amount of trade by country since the Feb. 24, 2022 invasion of Ukraine as represented by the width of the arrows and the percentage change in trade since the invasion as compared to the data for 2017 – 2021.
On Wednesday, Dec. 7, we will moderate your responses live online. By Friday morning, Dec. 9, we will provide the “Reveal” — the graph’s free online link, additional questions, shout outs for student headlines and Stat Nuggets.
1. After looking closely at the map above (or at this full-size image), answer these four questions:
- What do you notice?
- What do you wonder?
- How does this relate to you and your community?
- What’s going on in this graph? Create a catchy headline that captures the graph’s main idea.
The questions are intended to build on one another, so try to answer them in order.
2. Next, join the conversation online by clicking on the comment button and posting in the box. (Teachers of students younger than 13 are welcome to post their students’ responses.)
3. Below the response box, there is an option to click on “Email me when my comment is published.” This sends the link to your response which you can share with your teacher.
4. After you have posted, read what others have said, then respond to someone else by posting a comment. Use the “Reply” button to address that student directly.
On Wednesday, Dec. 7, teachers from our collaborator, the American Statistical Association, will facilitate this discussion from 9 a.m. to 2 p.m. Eastern time.
5. By Friday morning, Dec. 9, we will reveal more information about the graph, including a free link to the article that includes this graph, at the bottom of this post. We encourage you to post additional comments based on the article, possibly using statistical terms defined in the Stat Nuggets.
nytimes.com 12 01 2022


