- Bridge Over Oil’s Troubled Waters Is Hard to Find

By John Authers
Troubled Waters on Oil
It was the commodity largely blamed for the great spike in global inflation. Spurred by war in Ukraine, oil prices jumped above $100 per barrel to levels last seen in 2014. Since then, it has stabilized as inflation slowly trickled lower — and not even the current incarnation of the OPEC cartel appears able to stop it.
In the last few days, crude has wiped out all its gains after the surprise output cut. A report from the Energy Information Administration showed stockpiles fell 4.58 million barrels last week. But this news of substantial drawdowns, which should have supported the price, was overshadowed by the increasing perceived risks of a US recession.
Brent crude, the international benchmark, slipped below $81 a barrel, closing 2% lower on Thursday. Chartists dislike this. If the price cannot at least hold steady above $79, then it could easily drop in short order towards $75.75, Craig Johnson, chief market technician at Piper Sandler, said in a note.
The commodity has been testing the strong gains it made at the beginning of this month when the OPEC+ nations (broadly, the members of the long-established Organization of the Petroleum Exporting Countries, plus Russia) agreed to cut supply. That put global markets on track for a deficit that would widen as the year progresses, and provoked immediate fears that the benchmark price was heading back above $100. OPEC+ described the cutbacks as a “precautionary measure aimed at supporting the stability of the market,” but as the group forecasts a substantial jump in global oil demand this year, it was widely seen as a straightforward attempt to jack up the price:

As Points of Return wrote on April 4: “It was just the kind of ugly supply shock that created mayhem in the global economy in the 1970s, and again as recently as last year after the invasion of Ukraine. The immediate reaction was that this would pitchfork the world back into an inflationary morass.” Brent jumped 8% during the Asian opening the next day. But it then moved sideways for two weeks, while the latest slide has brought the price down 5.3% from its level on that April 4 opening — barely 1.5% higher than before the OPEC+ news broke. So far, at least, this is nothing like the forecasts that the cartel would force a big surge in prices.
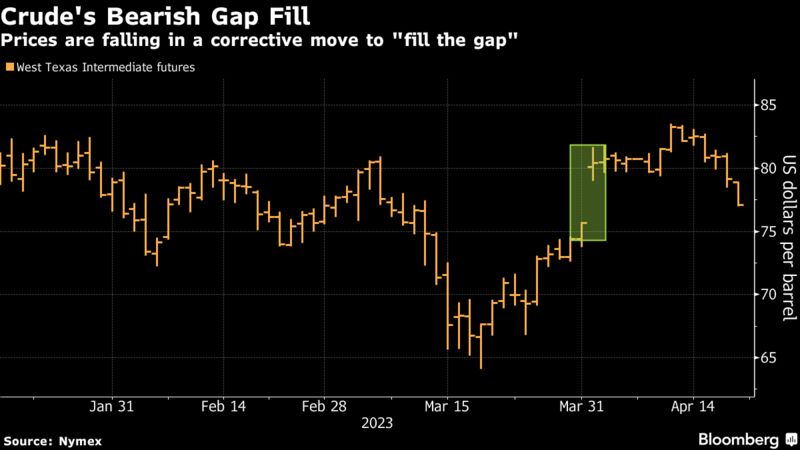
Oil’s drop is being accelerated by a technical correction known as gap fill. A sudden spike in prices — such as the one that occurred after the surprise supply cut — creates a breach in charts where numbers have moved sharply with little trading in between. Once prices fall back into the gap, there’s little to stop their decline:

For Paul Hickey of Bespoke Investment Group, the fact that prices can’t hold on to a bid for more than a few days doesn’t say much for the fundamental backdrop. To Win Thin of Brown Brothers Harriman, it reflects the growing concern surrounding global growth despite the considerable upside surprises in the Chinese economic data. (China’s gross domestic product increased 4.5% year-on-year in the first quarter, compared to an expected 4%, while retail sales topped 10%. More here from April 19.)
While an increase in oil prices is often taken as a sign of economic strength, it also increases the risk of inflation. If a manipulation of oil supply cannot force prices back up, that is great news for central banks, and should also aid the prospects for growth. The problem now is that the evidence of trouble for the economy is beginning to add up.
In the US, jobless claims appear to be consolidating in an upward trajectory, suggesting that the labor market is tightening at last, as companies begin to lay off workers. The latest numbers, released Thursday, came as yet another distasteful surprise:

The Leading Economic Indicators published by the Conference Board also came in very weak, and declining at a rate that implies a recession is a virtual certainty. That accretion of negative data seems to hit appetite for buying oil, just as it also prompted investors to buy short-dated bonds once again. The two-year yield, particularly sensitive to policy rates and the risks of short-term recession, declined as much as 10 basis points to 4.14%:

Some refiners have also worried that demand may not be strong enough to justify their purchases. After all, abnormally mild temperatures across major US metropolitan areas this winter have eroded the need for the heating fuel, causing inventories to swell relative to usual levels.
Despite this week’s pullback, crude is still up from a 15-month low reached in mid-March. But the lack of enthusiasm to take it higher suggests big reservations about the ability of supply restrictions to have much effect. It also tends to confirm the evidence from the bond market that sentiment is swinging back toward a belief in an economic slowdown with lower rates in its oily wake.
— Isabelle Lee
Just Let It Flow
What is happening to global liquidity, and how much does it matter? For a while during the pandemic, the money supply surged. That was followed, just as classic monetarists like Milton Friedman would have predicted, by a return to inflation. But now the money supply is contracting — or is it? And that leads to warnings that that would mean a swift move into deflation — or would it?
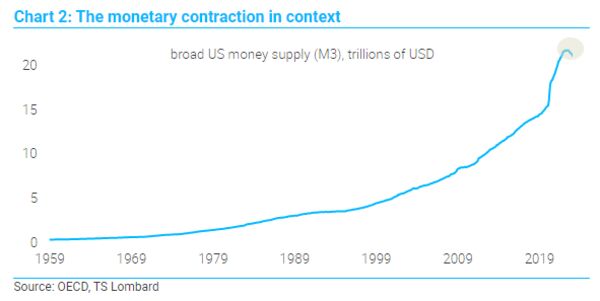
The argument that a declining money supply will lead to a slowdown and deflation has been made by several prominent monetarists. The logic is clear enough. With less money in circulation, less is spent, and that means prices fall. But how big of a deal is this? Dario Perkins of TS Lombard in London offers the following illustration of US money supply using the very broad M3 definition to put this in context:

Perkins is scathing about the notion that this is driving an imminent slowdown:
Think about it this way: when interest rates were low, wealthy individuals and corporates who sold bonds to central banks as part of the QE process were prepared to keep the proceeds in highly liquid funds. Bank deposits swelled and the stock of money increased. But now, thanks to significantly higher interest rates, they can see plenty of attractive alternatives. So, they are moving their cash into money market funds or reinvesting in government bonds. Meanwhile, central banks themselves are looking to reverse their pandemic interventions by conducting QT [Quantitative Tightening], largely for the purpose of unnecessary virtue signaling.
The bigger story “is that the fiscal stimulus has been withdrawn, and supply chains have normalized,” and all while there has been no acceleration in bank lending, Perkins says.
Some of this argument breaks down into a classic debate between the impact of stocks and flows. The flow of new money supply (using the M2 benchmark this time), is now negative. That hasn’t happened before, at least in the post-gold standard regime. Meanwhile, if those same numbers are expressed as a stock, money supply remains remarkably elevated, and the recent contraction has had a minimal impact on this:

There are arguments, however, that a decline in the money supply does matter, and not only from monetarists. David Bowers of Absolute Strategy Research in London points to the total amount of debt in the US, as a proportion of GDP. For the first time since the country was still dealing with the debts incurred to finance the Second World War, debt has come down, and sharply:

The broader effects of the monetary and fiscal stimuli that arrived with the coronavirus in 2020 and then vanished in 2022 still appear to be profound, as this has created a true de-leveraging across the economy on a scale that hasn’t been seen before. And while the effect is particularly strong in the US, where the authorities were generous with their payouts, the pattern is the same if we look at the global picture. After a big spike, debt is coming down as a proportion of GDP. That is being led by central banks, as this chart from Bowers shows:

If deleveraging is hard to handle, then that naturally implies reason for concern about the health of the banks. As we learned last month, they face pressure holding on to their deposits. The latest news, with the larger US regional lenders announcing their first-quarter results, suggests pain for their shareholders, but not a crisis — at least not yet.
However, there is more to the financial system than banks. That was a lesson from 2008, when entities as varied as the Reserve Fund, a money market mutual fund, and AIG, an insurer, turned out to be critical weak links in the chain. With the biggest banks now more tightly regulated, risk has migrated to non-banks. A flurry of reports on non-bank financial intermediaries (NBFIs) shows that regulators are nervous about the risks. That comes through in papers from the New York Fed, the Financial Stability Board, and the International Monetary Fund, which had this to say in a blog post earlier this month:
High levels of interconnectedness among NBFIs and with traditional banks can also become a crucial amplification channel of financial stress. Last year’s UK pension fund and liability-driven investment strategies episode underscores the perilous interplay of leverage, liquidity risk, and interconnectedness. Concerns about the country’s fiscal outlook led to a sharp rise in UK sovereign bond yields that, in turn, led to large losses in defined-benefit pension fund investments that borrowed against such collateral, causing margin and collateral calls. To meet these calls, pension funds were forced to sell government bonds, pushing their yields even higher.
As the FSB makes clear, there are plenty of what Donald Rumsfeld would have called “known unknowns” in the non-bank financial sector; the regulators know that there are lots of things going on that they aren’t aware of. This chart from the FSB illustrates just how little grasp they believe they have on the problem:

The “narrow measure” refers to the non-banks that they have identified as potentially causing bank-like systemic risks. But they also recognize that non-banks as a whole account for almost half of all global financial assets, and that the amount held in “other financial institutions” (a category that excludes banks, and also excludes pension funds) are roughly three times that size. The implosion of UK pension funds last year, confirmed to regulators that there were indeed big, unknown risks in non-bank institutions.
These risks may, perversely, have turned around liquidity. Mike Howell of CrossBorder Capital, who keeps detailed real-time indexes of liquidity, says that the money started to flow again in October, when liquidity made a major low:

China’s attempts to revive after its Covid-Zero restrictions helped the trough to form, but Howell suggests that the crucial driver was the implosion in the UK gilts market that month. From that point on, central banks were determined to provide the cash to prevent any repetition of such a crisis, even as they continued to raise rates. They showed the same reaction to last month’s bank failures, issuing liquidity but hiking rates. According to Howell:
Our original conjecture that Central Banks have effectively split their policy tools to use quantitative or balance sheet policies (QE) to ensure financial stability, whilst targeting inflation with interest rate policy is becoming more widely discussed in the media. This splitting of roles can explain why interest rates have risen at the same time that Global Liquidity is turning higher.
In practice, it’s difficult to keep these roles distinct, even if they are conceptually different in theory. So central banks’ anxiousness about non-banks has prompted them, willingly or otherwise, to start a new cycle of growing cash flows. Howell says the global liquidity cycle has bottomed: “Since liquidity leads, this is entirely consistent with a coming economic recession, as weak economies typically release liquidity back into financial markets and encourage Central Bank ease.”
This is not good news. But as we’ve discovered several times over the last 25 years, attempts by the regulators to tide markets through difficult times often work, but at the expense of driving a rise in asset prices. So, while the trend toward deleveraging is clear, it’s possible that it is already prompting the kind of reaction from them that will create profits for investors who hold financial assets. It’s an ill wind.
— With assistance by Isabelle Lee
________________________________________________________


